"Lessons from the Past: Data-Driven Insights on the Titanic"
Today we embark on a voyage through history, with a dataset that has captivated the imagination of data scientists and historians alike—the Titanic dataset. As we delve into this case, we'll not only uncover the stories and the tragedy of the ill-fated Titanic, but we'll also learn how to harness the power of data analytics to extract meaningful insights and predict outcomes. Our journey will take us from understanding the context of the dataset to building a predictive model that could help us answer one haunting question: "What factors contributed to the survival of some passengers over others?"
Contextual Background
The RMS Titanic, often remembered as a symbol of human ambition and tragedy, set sail on its maiden voyage on April 10, 1912. It was the largest and most luxurious ship of its time, deemed "unsinkable" by its creators. Yet, on the night of April 14, it struck an iceberg and sank, leading to the death of over 1,500 passengers and crew members. This disaster has since become a poignant case study for safety regulations, human error, and socio-economic factors at play during emergencies.
The Dataset
The Titanic dataset is a rich collection of information on the passengers aboard the ship. It includes variables such as age, sex, ticket class, fare paid, and most importantly, survival. The dataset is often used in predictive modeling to estimate the likelihood of survival based on various features. It's a classic example of a binary classification problem in machine learning, where the outcome is either 'survived' or 'did not survive.'
Conclusion
Through the Titanic case, we will learn that data is not just numbers and categories—it represents real lives and stories. It's a testament to the importance of data-driven decision-making and the responsibility that comes with it. By the end of this class, you will not only have built a predictive model but also gained a deeper understanding of the human aspects behind the data.
Titanic exercise
With bigML you can simply apply and evaluate a selection of machine learning algorithms in a standardized framework. For this you do not need any coding experience. Create an account on www.bigml.com
When you enter BigML for the first time you see a blank canvas.:
Please login or if logged in Choose Dashboard
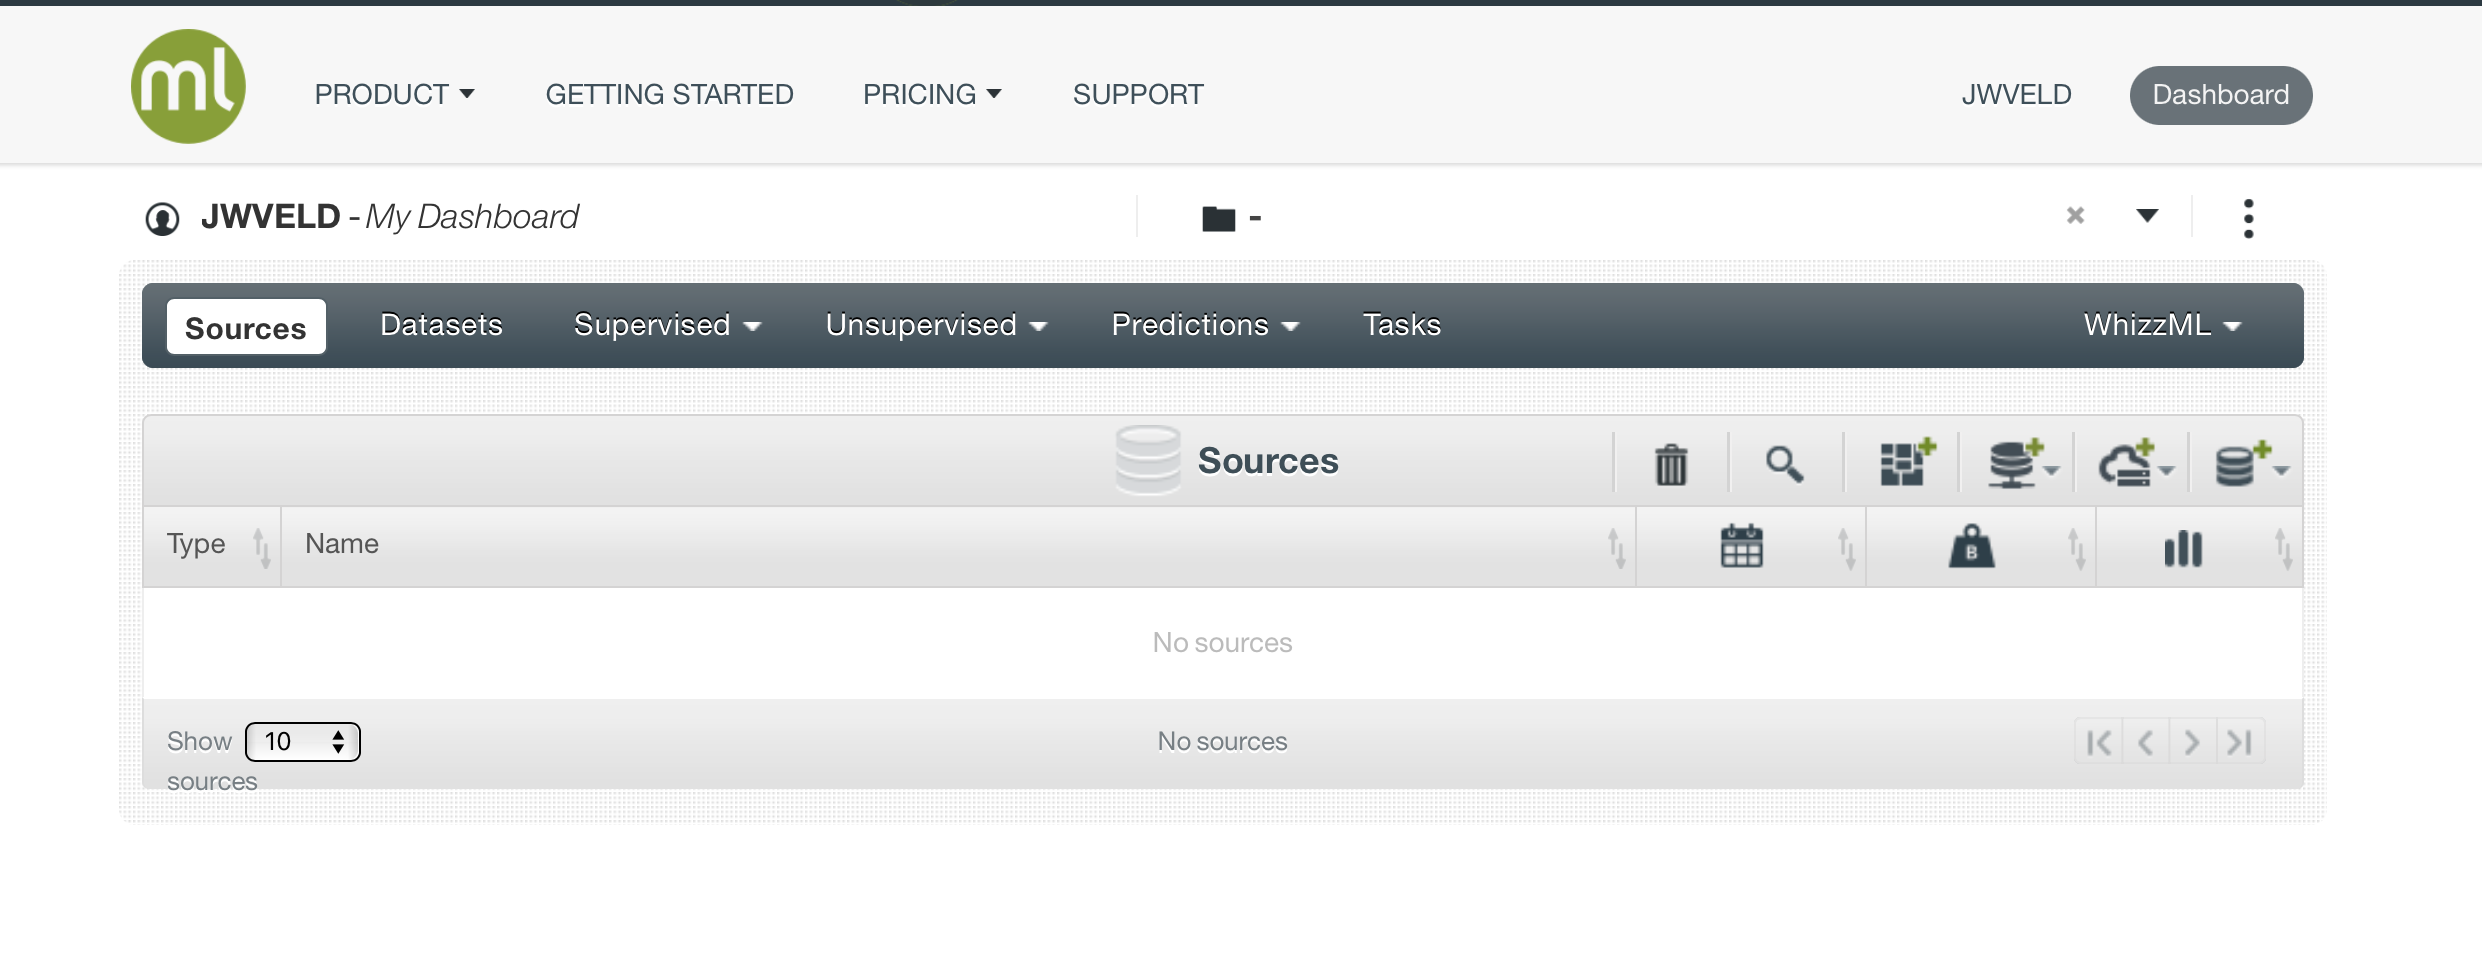
This is the blank canvas.. from here you can start upload data, create datasets, manipulates data, create and evaluate models.
When you want to organize your projects, hover over the 3 dots at the right side of the screen:
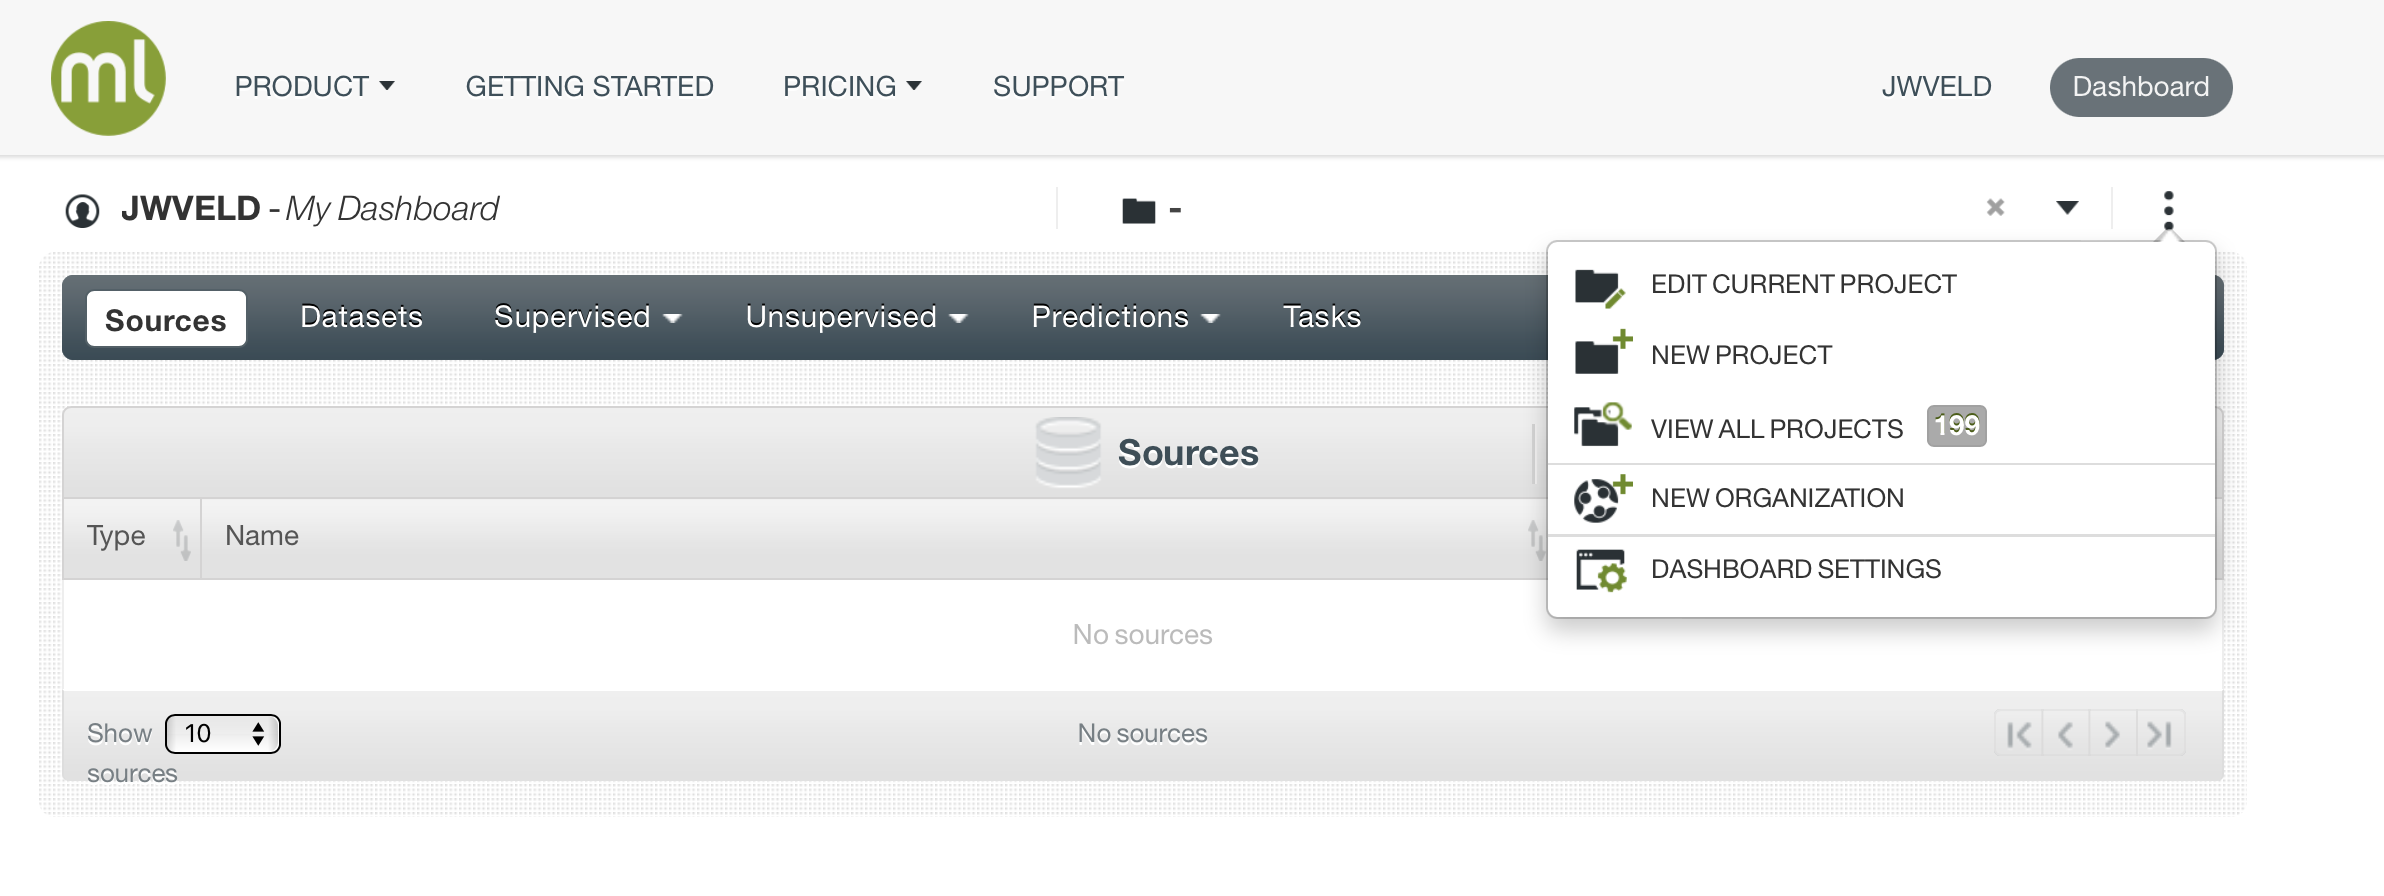
Here you can make new projects or alter existing ones.
The normal procedure is to start creating a project and then upload the dataset inside the project to start..
Create new project and then name it “Titanic”
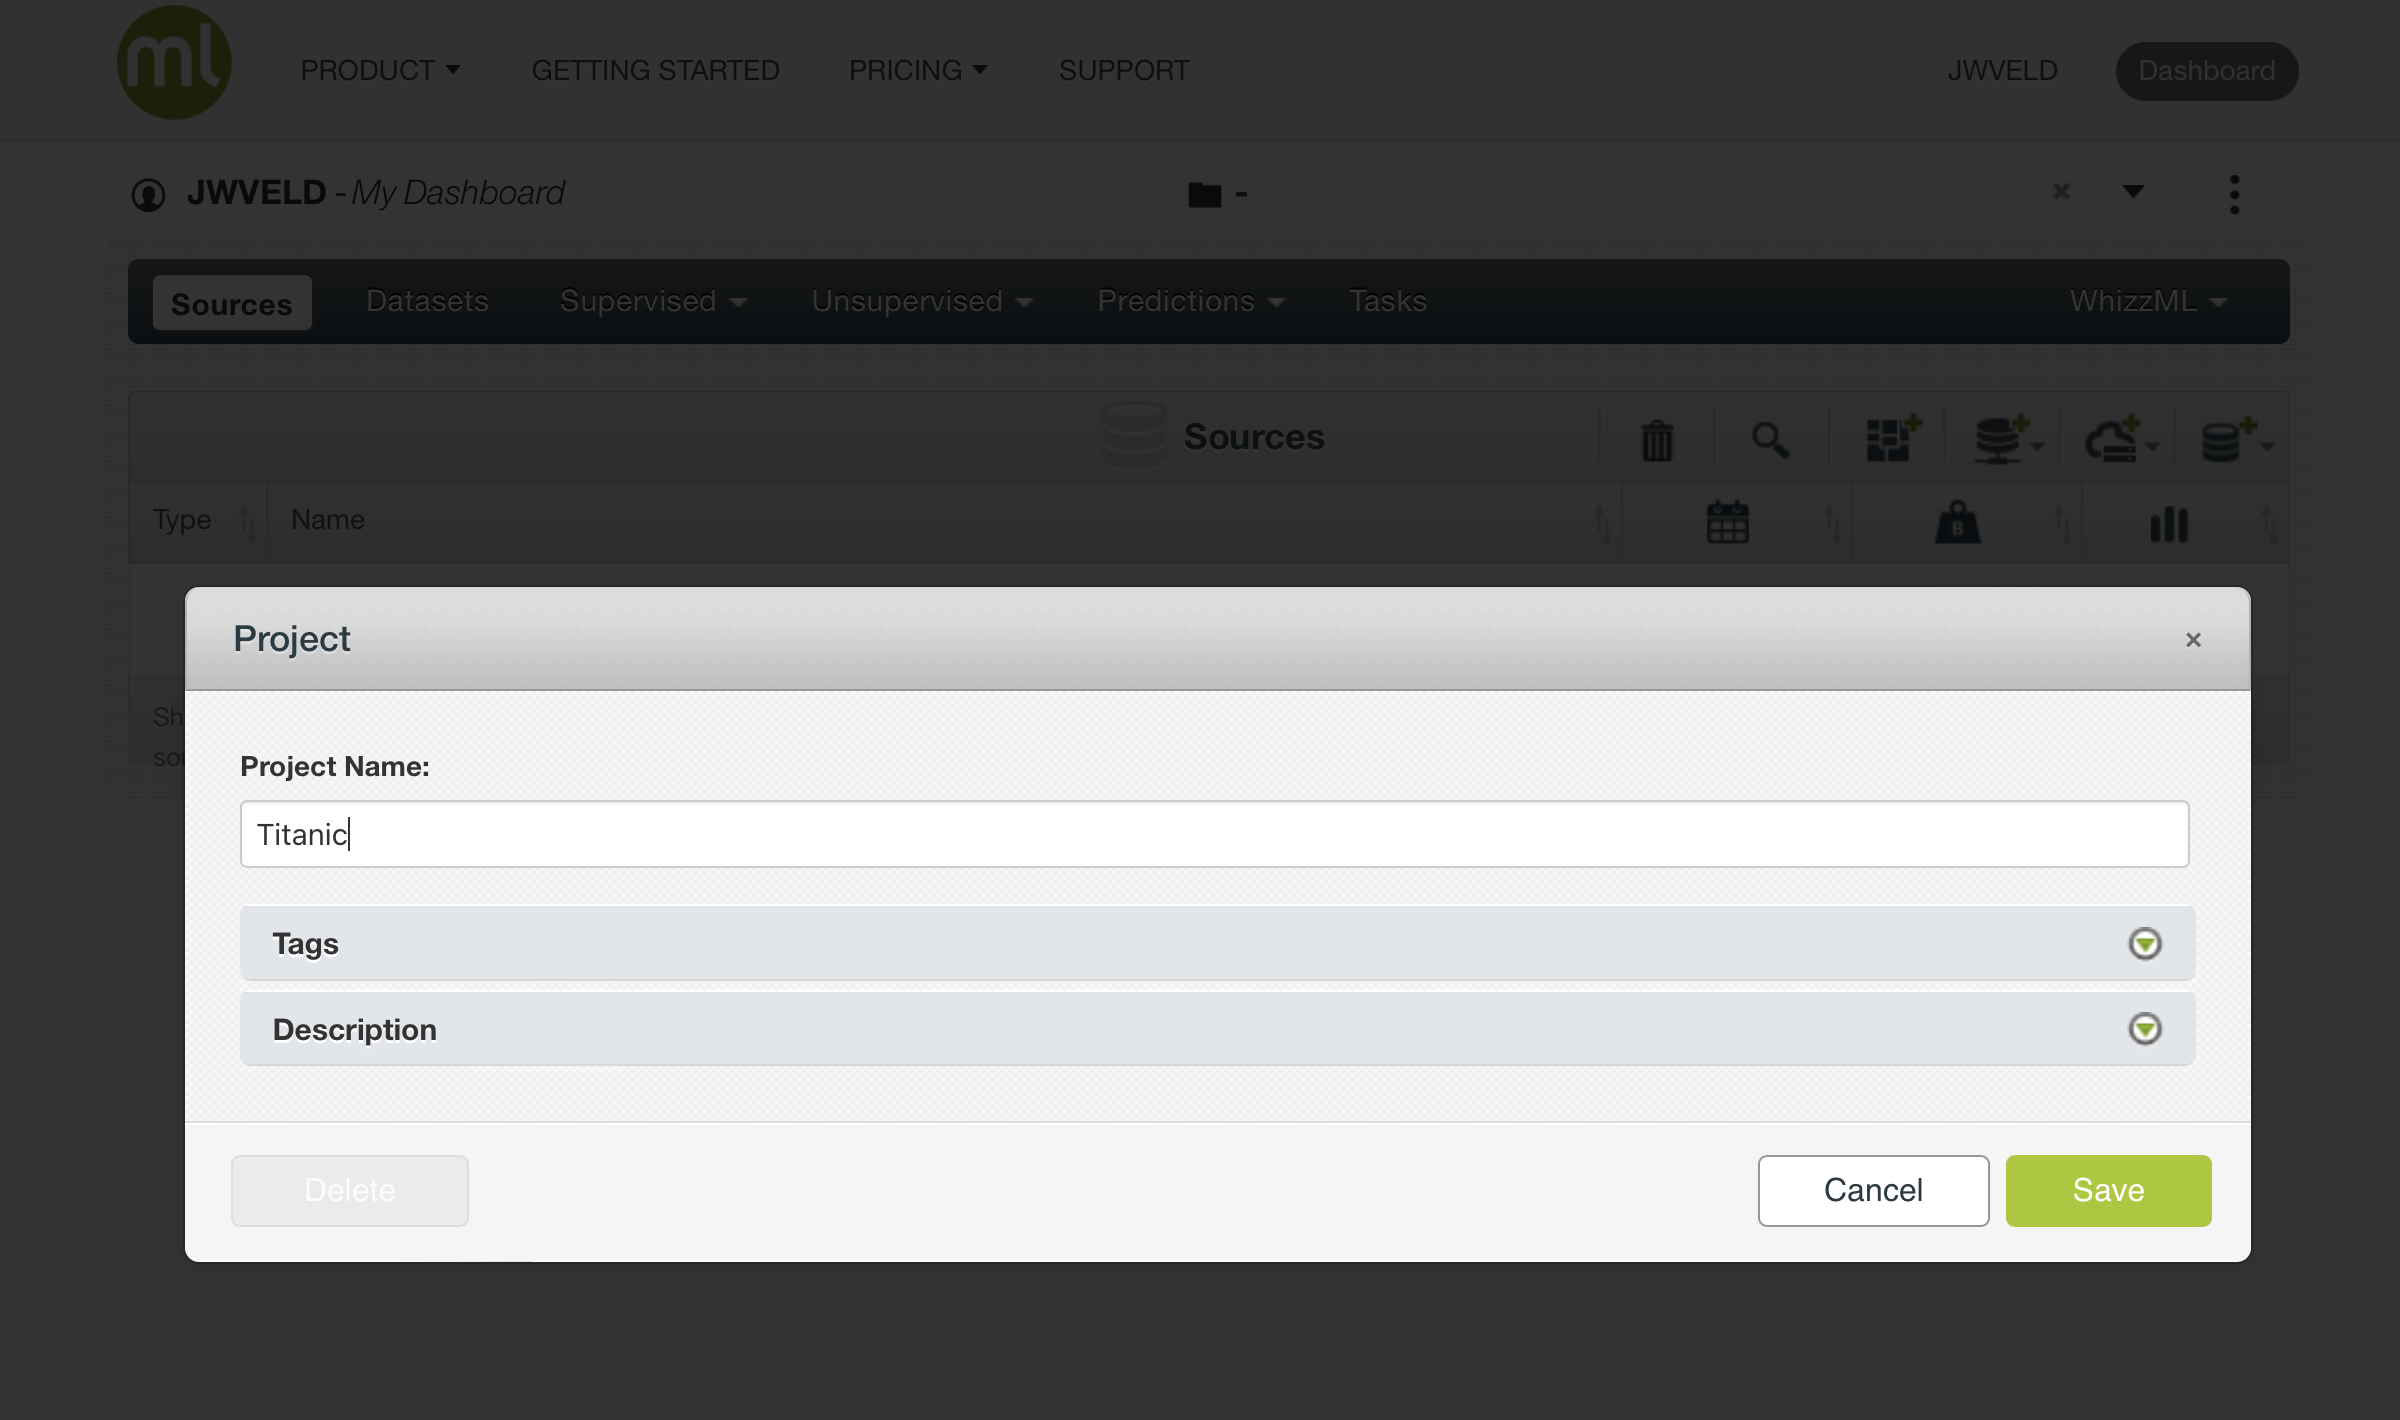
Now the project shows up in your project list…
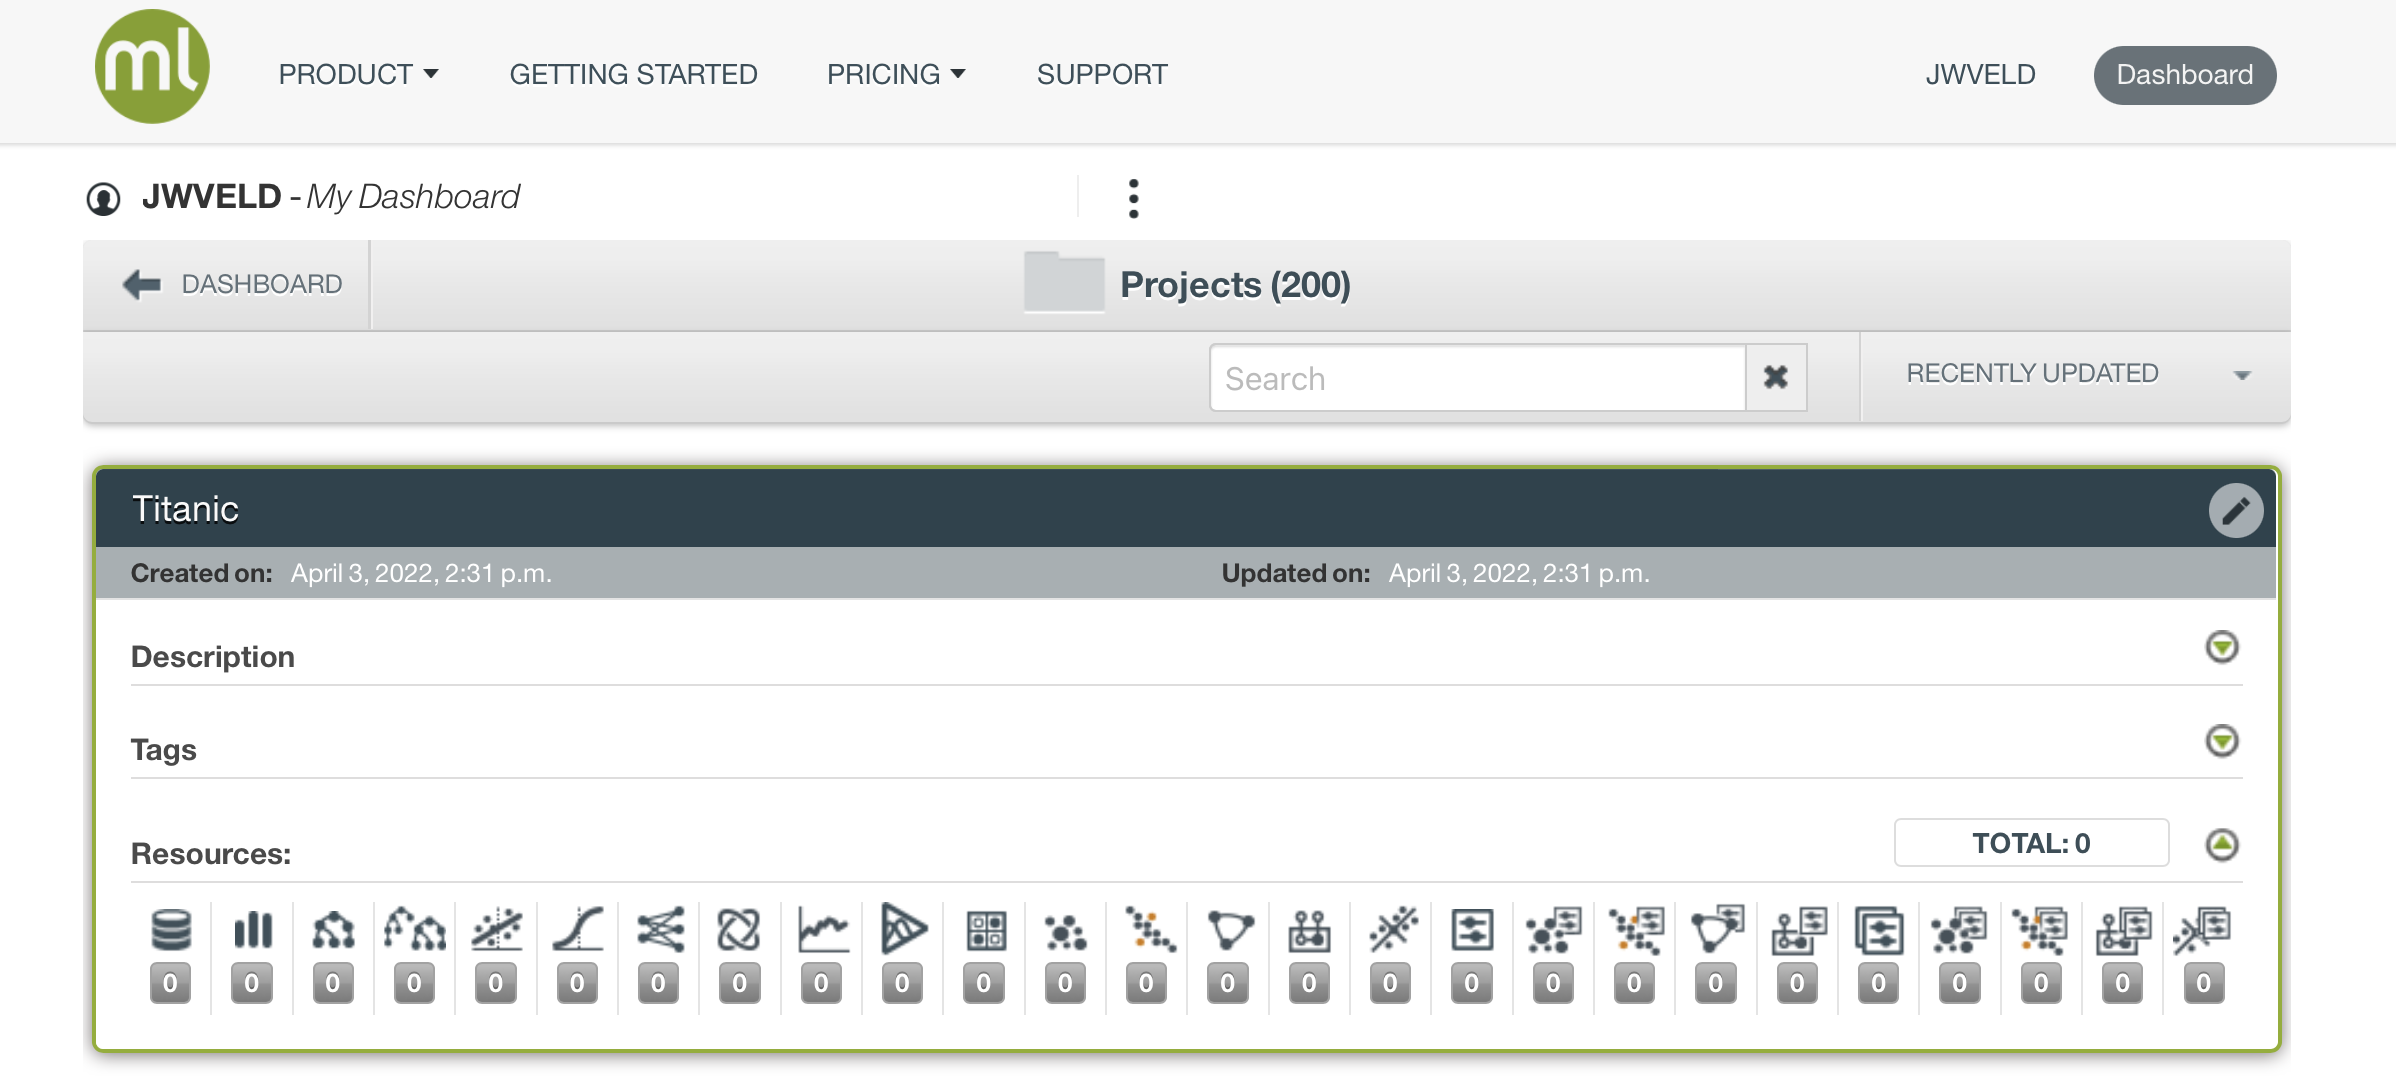
Click on the name titanic to open the project and start the work on the titanic case
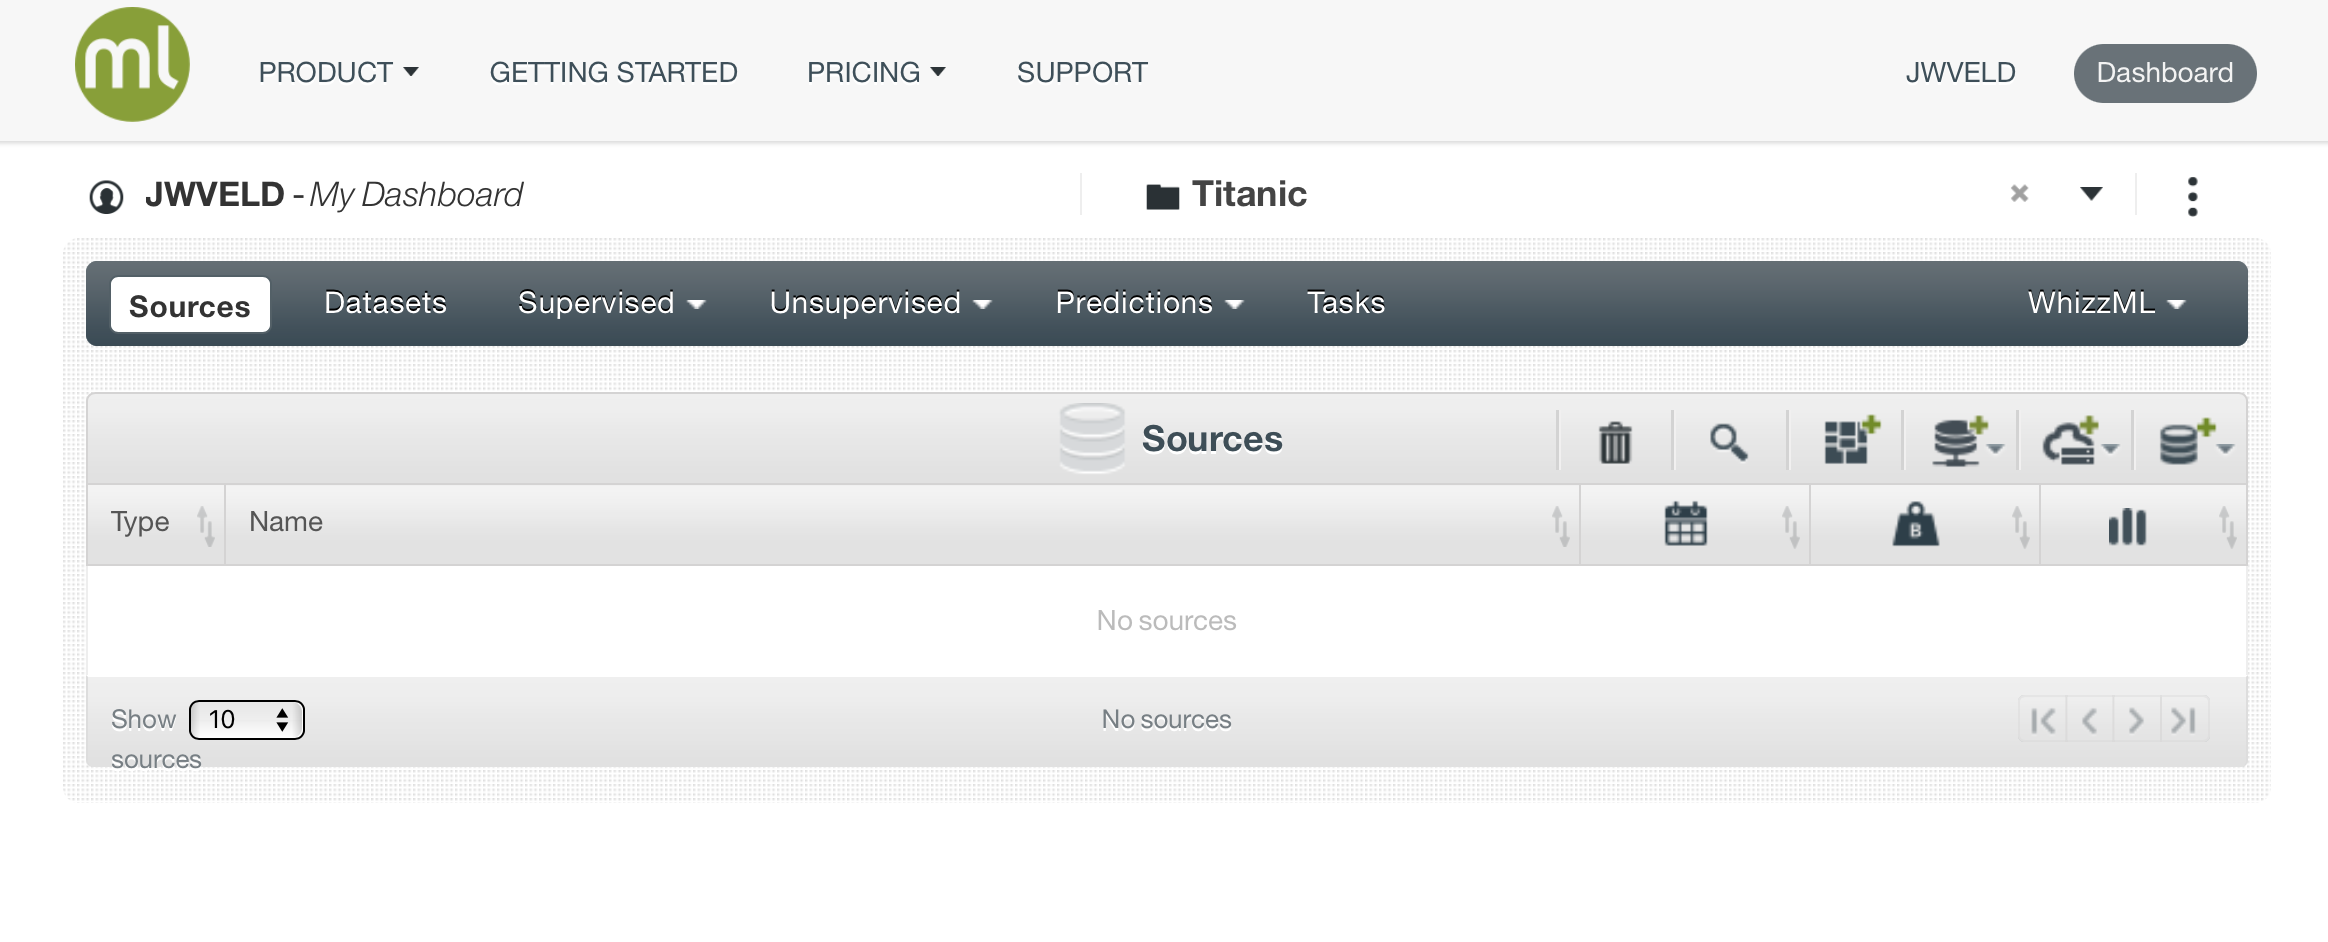
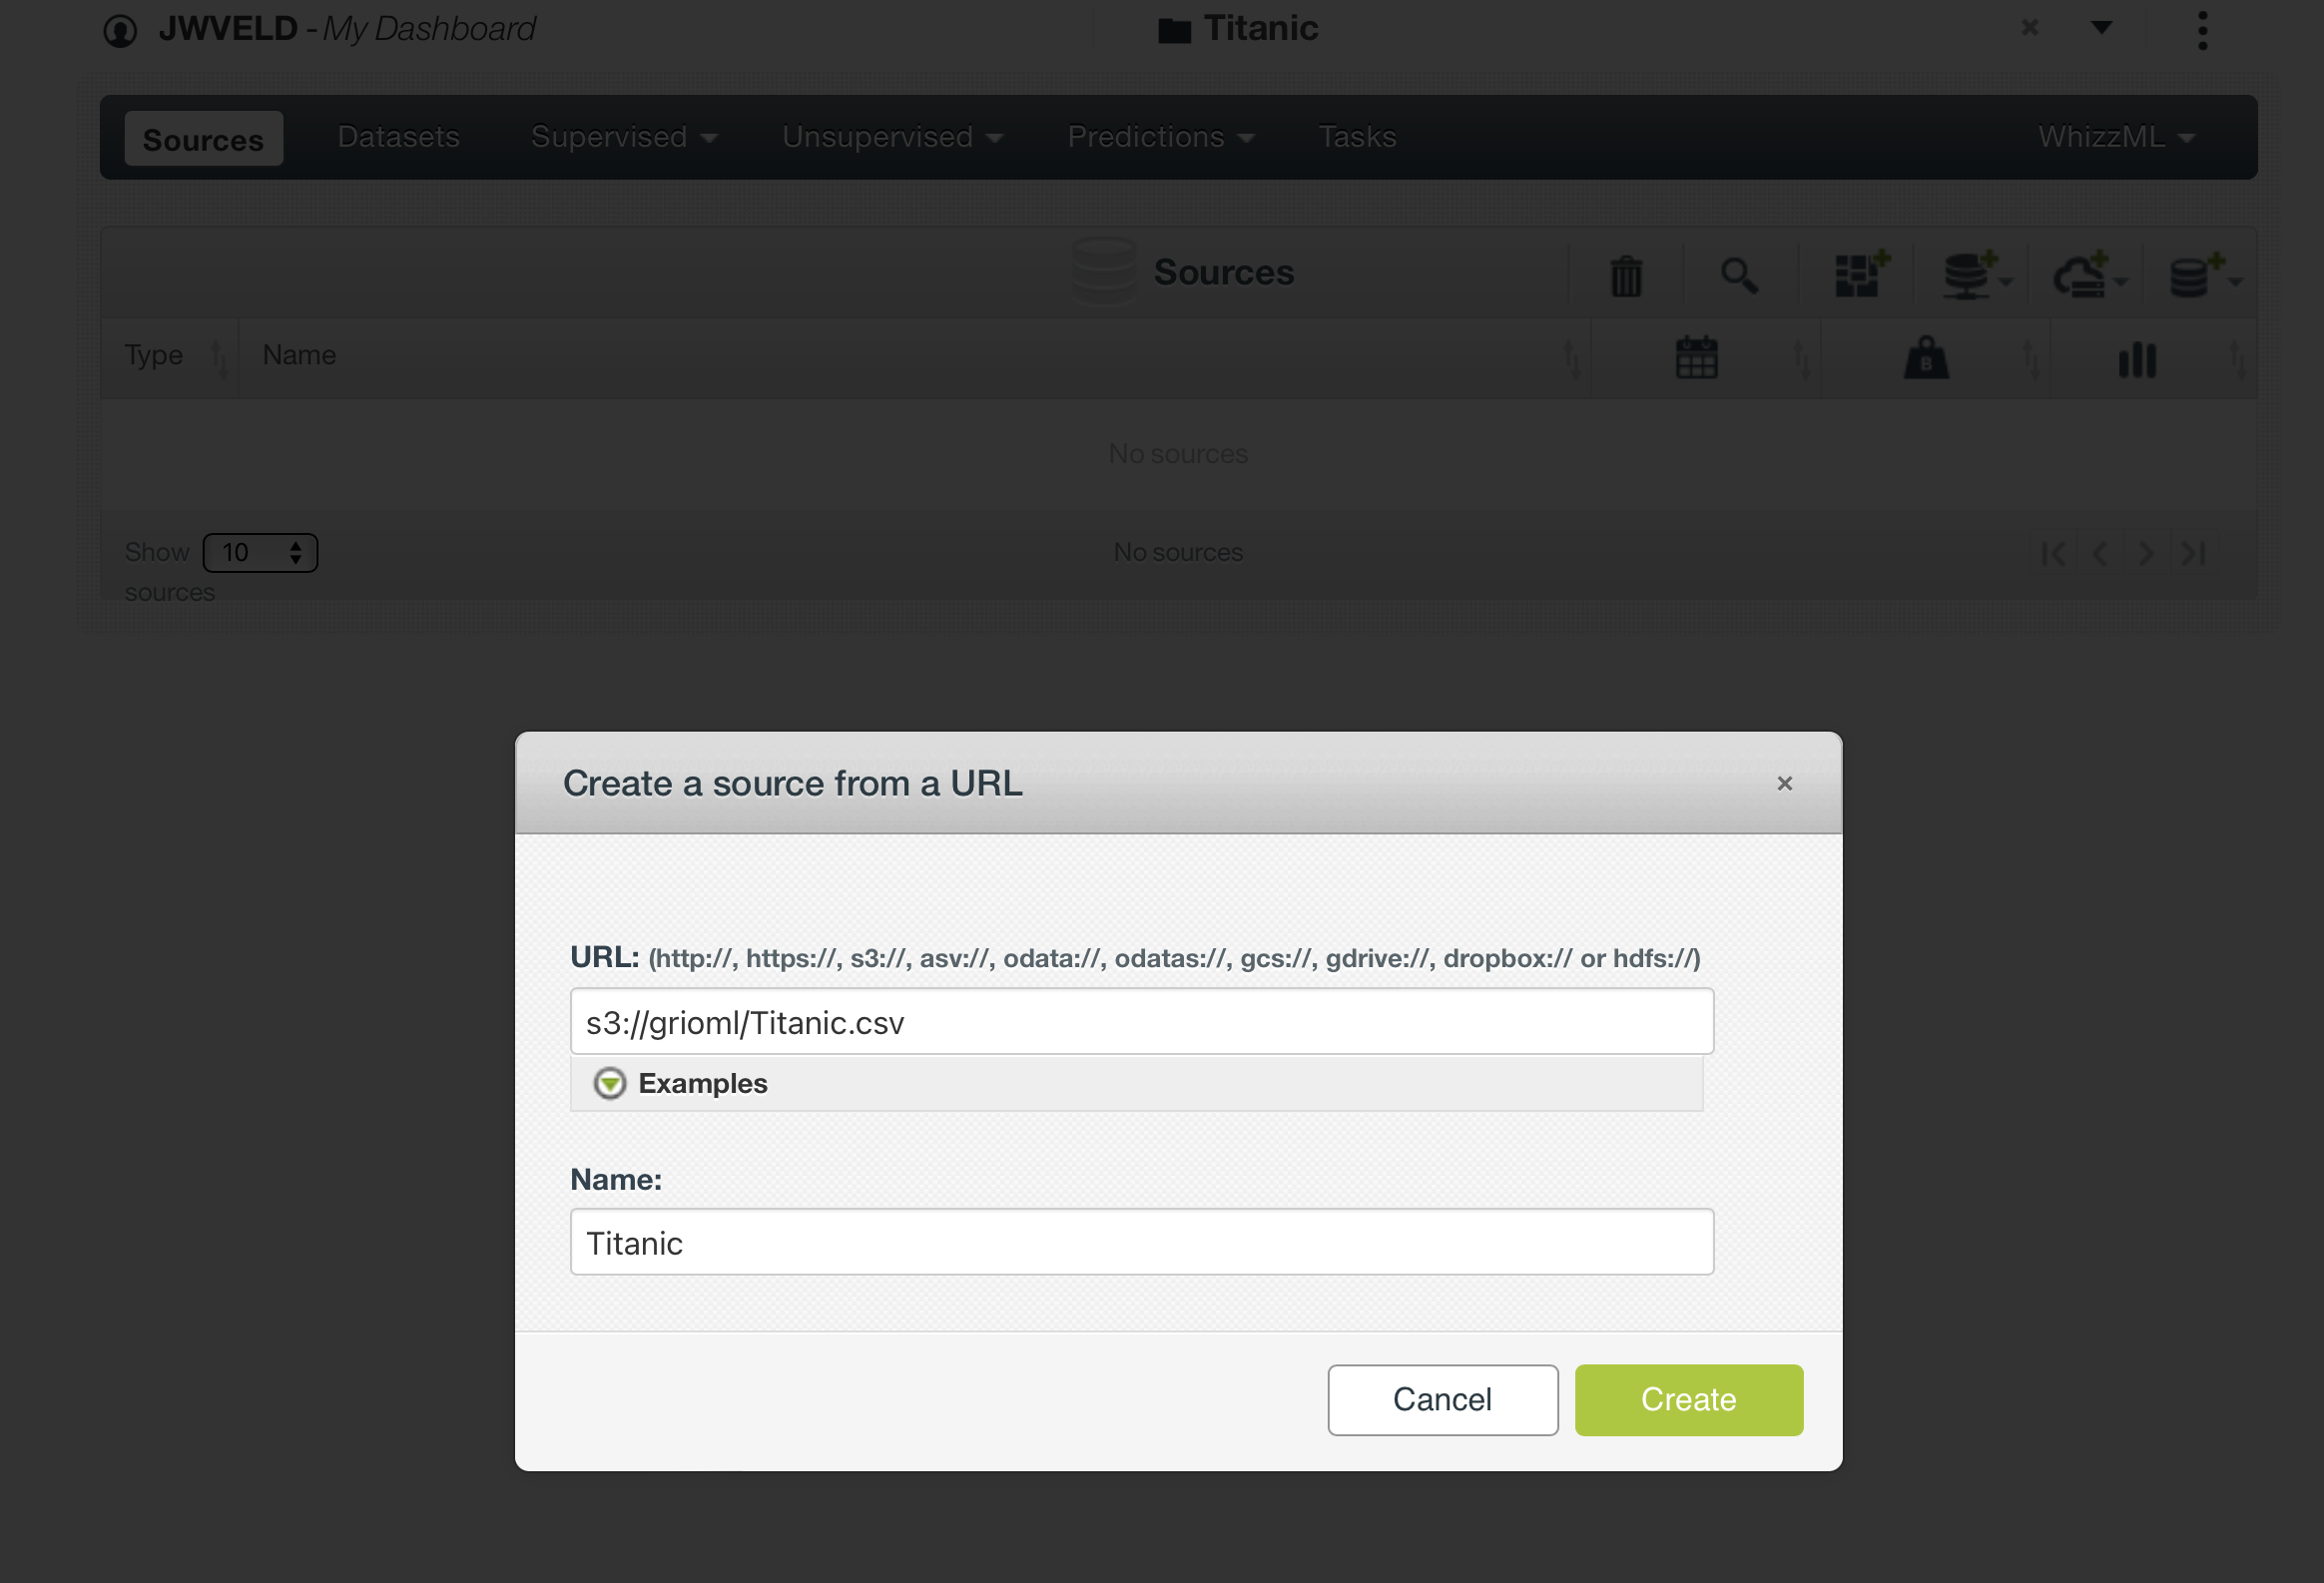
The first step is to get data in. That process is called Creating data sources. On the right you see icons that show you all the possibilities to get data in, the one opens up here are the direct way, other way’s are connecting to databases or elastic search etc.
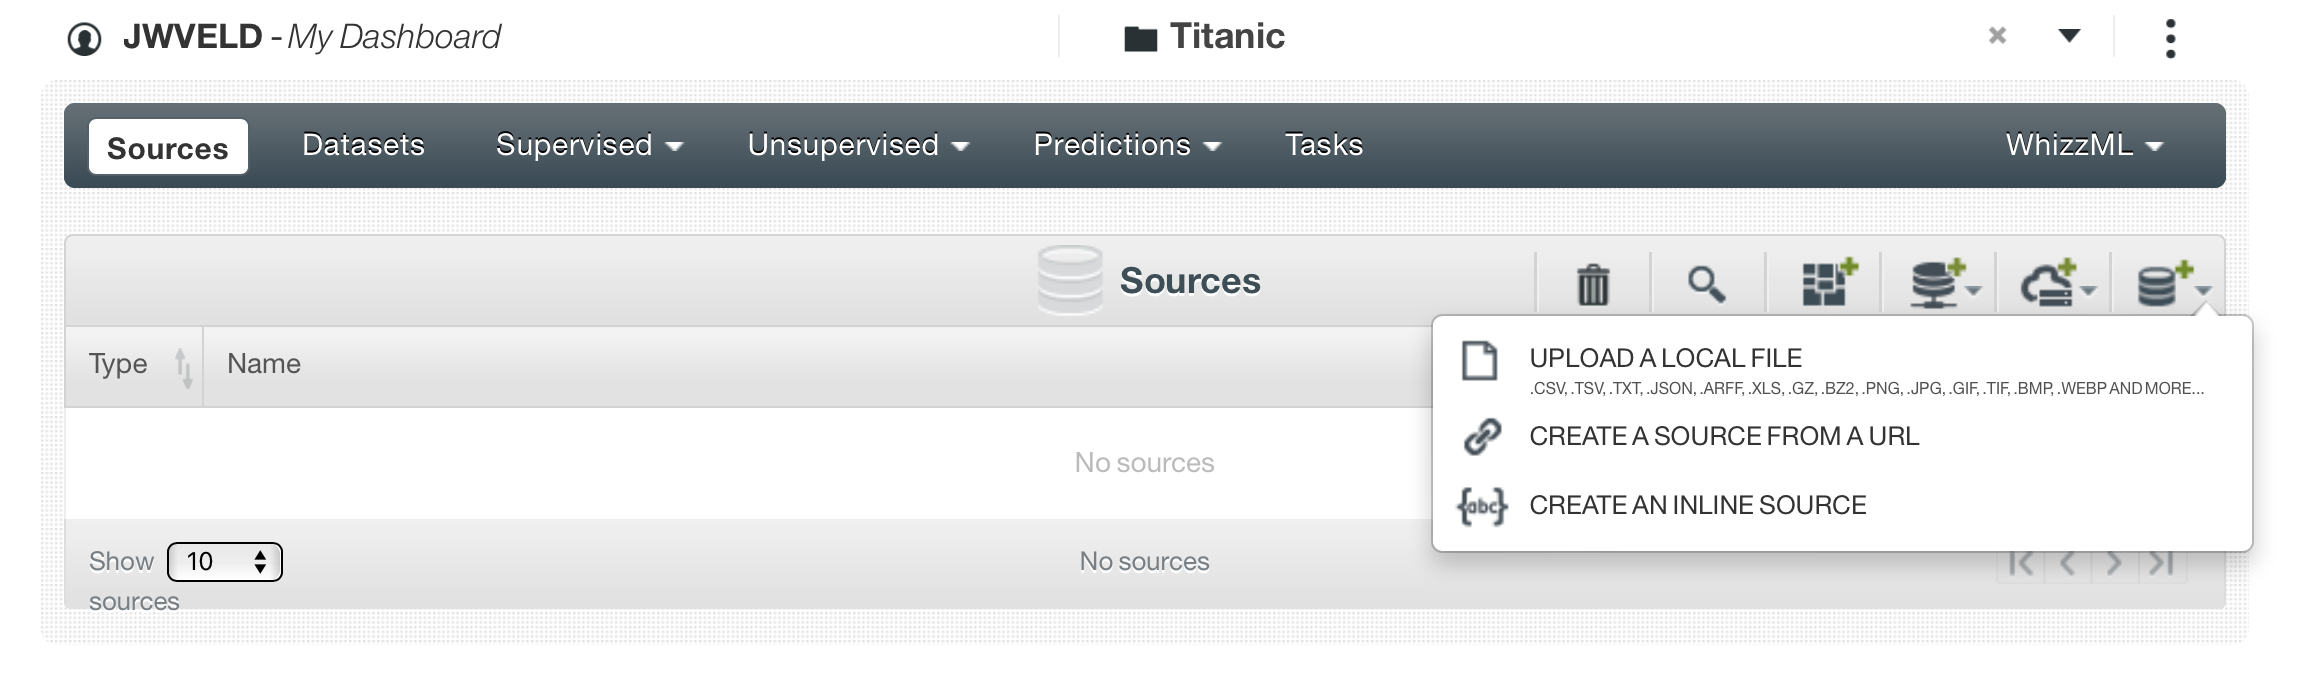
We create a Data Source by Create Source From URL and the url = s3://grioml/Titanic.csv
Here I created a source file for this exercise, just a plain normal csv file, could also be an excellent file.. for example..
Then the following shows the process of creating models and evaluating them.
Titanic data
Let’s take the titanic data that we used before and fit the following four models on a training version (80% of cases) of that data set.
Grab the data set
We can use the following code block to directly load the data in our workspace:
Create a project:
Data source: s3://grioml/Titanic.csv
Prepare the data / create a dataset
Validation set
Let’s split the titanic data into a training and validation set(80/20). Before we do so, we fix the random number generator seed in order to allow for reproduction of our results. Any seed value will do. My favorite seed is 123.
Modeling
We now go through the four models where we predict Survived from the other features in titanic - with the exception of Name, naturally. If we would use Name, we would fit a zero-residual model: i.e. a model for every row seperately.
We first need to set the target for ease of the next steps
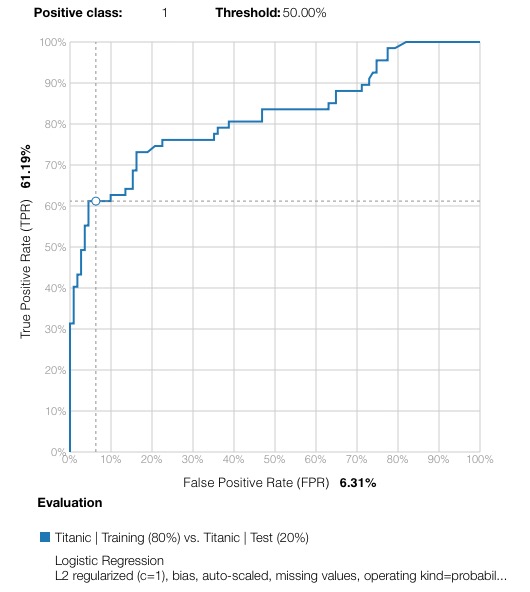
Logistic regression model
Let’s fit the logistic regression model
First take out the name as a preferred field, BigML does encode all text and categorical fields so they will automatically be taken into account when modeling.
Try out modeling with name in the set and you will see it tries to fit towards names. Keeping it out gives the following result:
And Evaluating the model gives these results:
The simple model gives this result AUC 0.8194 :
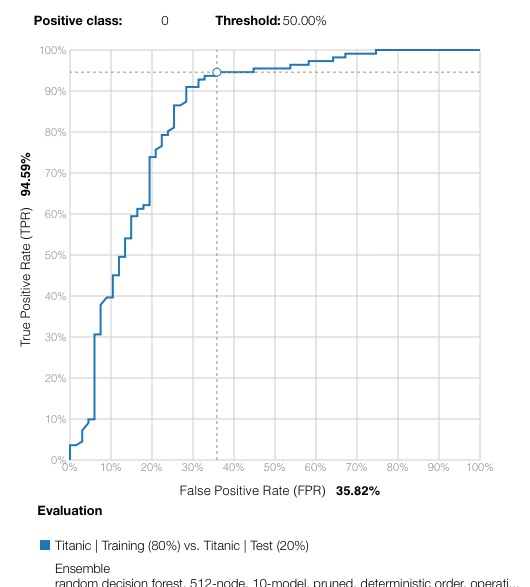
Random forest
Let’s train the random forest:
And look at evaluations
OptiML with cross validations
Now we see that there is a potential in this dataset, we selected features and created better models ourselves lets see what an optimized version could do:
And get yourself a cup of coffee and read a good book on AI/ML statistics, while BigML keeps experimenting with models and hyperparameters to find the optimal model.
Doing cross-validations / trees / regressions / neural nets and forest boosted aranomized etc.